Here’s an interesting fact for you: in the 2012 vote for state assembly seats in Wisconsin, candidates from Party “A” garnered 174,000 more votes statewide than the candidates from Party “B.” In fact, Party “A” received 53% of the votes in the state legislative races, while Party “B” received 45%, with the remainder going to third party candidates.
Since one of the hallmarks of our democracy is “one person, one vote,” it would be safe to assume that Party “A” also won 53% of the Assembly seats, while Party “B” controlled 45% of those seats. Or at least something close to that, right?
Well, no, as a matter of fact, the outcome of that election was that Party “B” ended up with 60 of the 99 Assembly seats, while Party “A” ended up with 39. To sum it up, Party “A” got 53% of the votes, but ended up with 39% of the seats, while Party “B” got 45% of the votes and took 60% of the Assembly seats, making it the majority party, and ruler of the legislature.
Does something smell a little fishy to you? I hope so.
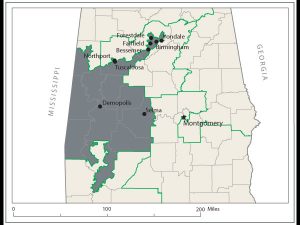
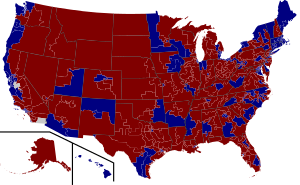
This crazy district in Alabama ensures one power stays in power. Care to guess the name of that party?
This crazy mathematical outcome is brought to you through the magic of “gerrymandering,” where legislative lines are drawn so that one political party is favored over another. The mathematics of this is not terribly complicated: all it requires is creating districts where all the voters from one political party are either concentrated into a small area, or “diluted” into districts with voters from the opposing political party. This is a practice that has been around since the founding of the United States; it was even practiced by that great patriot Patrick Henry to prevent James Monroe from being elected to the House of Representatives.
This is a small example of what happened in our national election, where the candidate from Party “C” earned close to 3,000,000 more votes than the candidate from Party “X.” If this seems familiar, it’s because the exact same thing happened in 2000 election, when the losing candidate from Party “C” earned over 500,000 more votes than the candidate from Party “R.”
Part of the reason for this is that the concept of “one person, one vote” has always been a fictitious idea in U.S. history, sealed into our Constitution from the founding of the republic when slaves were counted as 3/5 of a free person for census purposes, yet deprived of the power to vote.
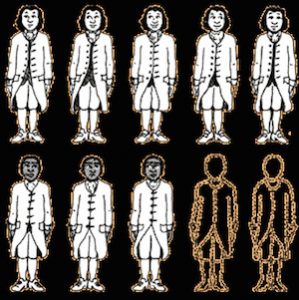
States with large slave populations got 60% more representation due to the 3/5 “compromise.”
This meant that states with large slave populations were able to wield far more power than was mathematically possible if only free persons were counted. If you lived in a state like South Carolina, where nearly half the population was enslaved in 1790, then your vote was worth almost twice as much as other citizens (actually, a free white male with property) who lived in a state that had few to no slaves.
That principle is alive and well in our electoral college system, which gives disproportionate amounts of power to states with very small populations. A person living in state “W,” with a population of fewer than 600,000 people, has twice as much say in our national elections than a state like “NY” with over 3 times the population.
If all this is making you want to pack your bags and move to a “real” democracy, you’re not alone. However, through the power of mathematics, there may be a fix for places like Wisconsin (and many other states as well), where the voters choose one thing and end up with something very different. As this is being written, a major case is moving through the courts which will bring some fairness to the system, so that the majority of the voters will actually get the majority of power. Isn’t that a good thing to maintain a healthy democracy?
Coming soon to the United States of America: Representative Democracy!
On November 21, 2016, a federal judge ordered the state of Wisconsin to re-draw the state districting maps based on a recently developed mathematical measurement called “the efficiency gap.” This is defined as “the difference between the parties’ respective wasted votes in an election, divided by the total number of votes cast.”
To put this into more understandable terms, the statisticians who developed this measurement came up with a number they called “wasted votes.” These votes come in two forms: the first are “lost votes” that are cast by people voting for the losing party, and “surplus votes” cast by the winning party. For example, lets say there is an election where five seats are up for grabs. The results for four of the districts is a 57% to 43% win for Party A, while the final district is won by Party B with an outcome of 85% to 15%. Party A gets 4 seats, Party B gets 1 seat. Sounds fair, right?
Not so fast, pal.
Had the districts been drawn differently, the 85% of the votes earned by Party B (a surplus of 34% over the 51% needed to win that district) could have been distributed over the other 4 races, giving Party B a better shot at occupying more seats. By doing a simple calculation, we find that there was an efficiency gap of 40% in Party A’s favor. If the efficiency gap was brought down to a more reasonable 3-4%, the actual outcome would give 2 seats to Party A and 3 seats to Party B, a much more “representative” outcome of the voters’ intentions. By re-drawing the districts so that there are fewer lopsided races like this, we actually end up with a more robust and representative democracy.
For those of you who despair at the state of our nation, it should be remembered that while it was mathematics that got us into this mess, it is ultimately mathematics that will help refine our government so that it is truly representative of the the will of the citizens.
This blatantly political post has been brought to you by SamizdatMath, where you can also find these fine materials that will cause you to think more carefully about our political and economic system:
Interdisciplinary studies at its best: use historical data to analyze the political composition of the United States in 1790!
At look at the recent election: who really was the biggest and boldest liar?
Was the 2016 election really won in a landslide? How common are “landslides,” anyway? A look at the outcomes of our 58 presidential elections, where students calculate percentages, percent of a number in a compelling context.
Explore how the wealth of the US is distributed; you won’t like the results.
And would someone please hit the “follow” star so that I can finally reach 500?